More on Peaking
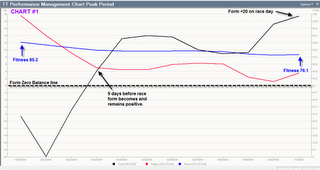
In my last post on the Peak period I explained how I go about managing fitness and fatigue in order to produce high form for an A-priority race. Here are two charts (from WKO+ software) which may help to explain this a little more clearly. Chart #1
This is for a road cyclist I coach who was preparing for Masters Nationals Time Trial on July 1. He races 65+ so his event was 20km. We started his Peak period 12 days before the race. At that time his fitness (blue line) was 85.2 TSS/day. You can see there is a gradual decline with fitness becoming 76.1 by race day. That’s a drop of about 11%, so right in the neighborhood of the 10% decrease that I attempt to get. Note how his fatigue (red) dropped very fast in the first three days and then stabilized before dropping again three days before the race.
This change in fitness and fatigue produced a rapid rise in form (black) so that nine days before the race it was positive and remained so until race day when it was +20. Chart #2
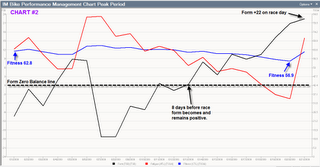
This is the Bike Performance Management Chart for the Peak period for an Ironman triathlete I coach who was preparing for Couer d’Alene on June 21. His Peak was longer than the one in Chart #1 – 21 days. His fitness dropped from 62.8 to 56.9 TSS/day. That’s about 9%. Again, right in the range I try to hit.
His fatigue (red) actually rose on day 6 when he did his last long bike workout. This was a five-hour ride with 20-minute intervals done in power zone 3 followed by a 15-minute run at Ironman race intensity. The fatigue steadily dropped down to the day before the race. The “sawtooth” spikes during this decline show when we did his mini-race simulation workouts which gradually became shorter (the intensity remained the same).
The hard ride on day 6 of the Peak period caused form (black) to drop quite a bit. But with eight days to go until the race it became positive and remained so until race day. On race day form was +22.
I wish I could tell you that if you followed this procedure every time before an A-priority race you'd have great performances. Unfortunately, as I mentioned below, that isn't always the case. There are just too many variables in a person's life, some of which may occur right before the race or even weeks before with lingering affects. Common disruptors of training are illness, injury and lifestyle changes. This is what happened to the triathlete. The road cyclist had an excellent race.


27 Comments:
Wondering what formula is used to measure fitness, form, and fatigue. On the chart they have values, what data is used to get those values?
Hi Joe,
In your previous post you briefly touched upon the different lengths of time needed for a peak period based upon the event.
Can you suggest the number of days needed for a peak period for a olympic distance ? What is the sport that requires the least amount of rest ?
I think a post on multiple peaking as the pro's in ITU would have to deal with would also be an interesting read.
Thanks
Mike
Hi Joe, thanks for the illustrations showing how form relates to fitness and fatigue. I'm wondering about the difference in smoothness between the two graphs. It's easy to understand how the spikes in fatigue and form in the second graph are due to race simulation workouts. What puzzles me is the smoothness of the first graph compared to the second. Did the first athlete do any race simulations during his Peak? If so, why doesn't his graph show similar spikes? Thanks. --Bruce
Mike--All I can do is talk in generalities. There are too many variables to give one number. So, generally the peak would be shorter for an Oly tri than an IM. Run is generally the longest and swim the shortest.
Bruce--Yes, the first chart is smoother. Reason why is because this athlete was training for a 30-minute event. So the workout stress was not as high as for an IM taper. That's part of the reason why we did a shorter taper for the first guy and longer for the IM.
Great post. Thanks Joe.
Another reason for the first chart being smoother is that it's a shorter time span so less workouts are represented.
In your training bible you mention criteriums requiring a longer taper due to the amount of rest needed to achieve a high peak wattage during short efforts typical of crits.
If the first guy was going for a 30min crit instead of a TT would the taper have been longer or di?
Great post! Thanks for sharing that Joe.
SteveW--Everything else being the same, probably not. Had it been a 1-hour crit then maybe I would have tapered longer. the stress would have been much greater in training.
Joe,
Is it reasonable to hold the Peak/Race period for 4 weeks, including one weekend of stage racing?
Thanks
Sam--Yes, it's possible but very difficult to maintain a true pak for that long. Trying to maintain fitness while keeping fatigue low. Very difficult to do that.
Joe...what would be your peaking plan if you had another A priority race (90-120' long) in three weeks after this one?
I've been following the "Bible" peaking schedule for an A race at the end of the season but have had difficulty interpreting workouts based on the LTHR zones...Is it possible for you to further specify what the LTHR zones look like translated into a model based on your CP60? This would be a huge help using the workouts in the Bible while training by power.
Hi Fabiano--That's a very difficult situation. As always, 'it depends.' Depends on limiters, how good base is, post-race fatigue/soreness, etc. If everything was good I'd _probably_ do a hard training week and then repeat the peaking process for 2 weeks.
Nathanael--I may not be interpreting your question correctly. I believe you're asking how do HR zones compare with CP values. Here's a rough approximation...
HRZ1 = >CP360(?),
HRZ2 = CP360(?),
HRZ3 = CP90,
HRZ4 = CP80 (very roughly),
HRZ5a = CP60,
HRZ5b = CP6,
HRZ5c = CP1.
If I didn't get your question right please let me know.
Hey Joe,
Thanks for your reply. I guess more specifically I was wondering what the different power levels would look like using percentages of CP60 (or FTP) as compared to the LTHR zones as listed in the Bible. Having Power zones based off of CP60 or FTP and seeing the direct comparison with the LTHR zones as listed in the Bible would make it easier to integrate the knowledge gained from Training and Racing with a Power Meter and your workouts in the Bible. Thanks again for your time!
Nathanael--I understand now. I've found Coggan's power zones to very similar to my HR zones for most athletes. In other words, when an athlete is in Coggan's zone 3 he/she is usually in my HR zone 3. here are Coggan's zones as a percentage of FTP/CP60...
PZ1 (HRZ1) <55%
PZ2 (HRZ2)56-75%
PZ3 (HRZ3) 76-90%
PZ4 (HRZ4-5a) 91-105%
PZ5 (HRZ5b) 106-120%
PZ6 (HRZ5c) 121-150%
Hey Joe,
Perfect...for me, seeing these zones side by side provides a solid bridge between Coggan's book and the wealth of information in the Bible. Thanks again!
Nathan--Sorry for the delayed reply to your question. It got lost temporarily in the shuffle. All of the data you see for these bike charts came from their power meters. To understand the details Google 'training stress score.'
Joe..thanks for your reply. You confirmed my theories. Best regards, Fabiano.
Mr. Friel,
Thanks for the posts on peaking. I'm trying to peak for Green Mt. over labor day. As it stands, I won't drop 10% from my ctl of approx. 73 (which was reached last weekend and will be reached again this weekend and next). As the plan stands now (with my TSS guesstimates), I'd end up in VT with a TSS of 66 and a TSB of positive 11. Given its a 4 day stage race, is this better or worse than a higher TSB and a bit more loss of CTL? Historically, I do well as a stage race progresses.
I am coached, just looking for other people's thinking too. I think we're on the right track, just want to really kick butt.
Thanks, Zach
Zach--Generally, I'd aim for a higher TSB by day 1. But that could be modified downward by what I know about the athlete's previous prep for A races, especially stage races. If you've been successful with a lower TSB in the past then there is no need to change now. Good luck!
Well, I'm not sure, as I didn't track TSB for previous stage races; I do know that with a TSB of plus 10, I didn't feel spectacular at my A race earlier this season. I have a pretty hard long race the Saturday before the SR starts, which is part of what drives my positive trending TSB back down with just 5 days to the start. It's a 52 mi. RR and I estimate a TSS of about 200-220. Between now and then, I have 2 hard workouts, one sharp and short (today), one with some overunders and longer (sat) and one short group ride. Any other recommendations on getting myself in the right place, TSB wise?
Thanks so much for taking time to answer the last one.
Zach
Hi Joe,
I am going to try the race week schedule mentioned in Total heart rate training and Companion to the cyclist's training bible as well as this blog. However, my TSB is -1.9 as I did 5 race reps(actually higher then zone 5b or cp6, but up to 15 secs shorter) on Tues., 4 reps(less intense,but longer becuase my wattage dipped below zone 5 a couple times. Made up z 5 time?) on weds. My TSS for tues was 104 and 66.4 on weds.
Should I still do 3 reps or wko at all today to get my TSB up? I also justg started vacation so I feel fresh anyways, since my job requires a lot of walking, standing...cleaning carpets=pushing pulling too.
Finally, I was unsure of the exact intensity of the reps so I maximized the reps on Tues, but found in the Companion case study, you had the guy do the reps at cp6.
Just trying to get a direct answer, so sorry for all the details...just in case.
Zach--I'd be guessing pretty much as you are at this point. But I'd err on the side of resting too much race week.
Anon--I'd have to know a lot more to be able to answer your question with some authority. As with Zach (above) it sounds like you need to go easy race week given your job. Peaking is a lifestyle matter.
If my stress balance is "slightly" negative, in my race week, should I have 2 rest days before the race tuneup the day before an "A" priority race? Thanks.
Also, was there an autopsy done on Steve Larrson? Was it steve or something else? He was an ex-pro racer that also did triathlons that died on the track a few monthes ago. Know what I'm talking about?
Anon--Yes, you probably need to rest. I've never seen anything on an autopsy on Steve Larsen. Anyone else know?
Post a Comment
<< Home